Gráfica de barras en R con ggplot2
Usa geom_col() cuando ya tienes el total de cada barra. Los datos son ficticios.
Los datos
library(tidyverse)
ventas <- read_csv("https://grafoso.com/r/ventas.csv", show_col_types = FALSE) |>
  mutate(importe = cantidad * precio)
por_producto <- ventas |>
  group_by(producto) |>
  summarise(total = sum(importe))
por_producto
# A tibble: 3 × 2
producto total
<chr> <dbl>
1 Café 47855
2 Galletas 26505
3 Té 30540Barras ordenadas, con etiqueta
reorder() ordena por el total, y coord_flip() acuesta las barras para que se lean mejor.
ggplot(por_producto, aes(x = reorder(producto, total), y = total)) +
  geom_col(fill = "#1d5bd8", width = 0.6) +
  geom_text(aes(label = scales::comma(total, prefix = "$")), hjust = -0.1) +
  coord_flip() +
  scale_y_continuous(labels = scales::comma, expand = expansion(mult = c(0, 0.18))) +
  labs(title = "Ventas por producto, enero a junio", x = NULL, y = NULL) +
  theme_minimal(base_size = 13)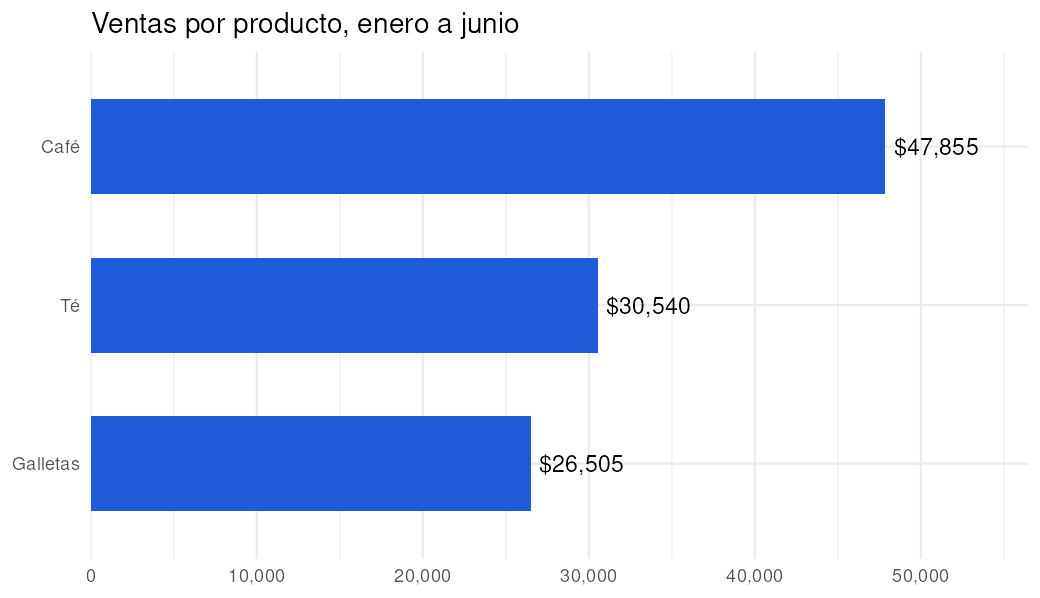
Barras por grupo
Con fill se colorea por categoría, y R agrega la leyenda.
ventas |>
  group_by(sucursal, producto) |>
  summarise(total = sum(importe), .groups = "drop") |>
  ggplot(aes(x = sucursal, y = total, fill = producto)) +
  geom_col(position = "dodge") +
  scale_y_continuous(labels = scales::comma) +
  labs(title = "Ventas por sucursal y producto", x = NULL, y = NULL, fill = NULL) +
  theme_minimal(base_size = 13)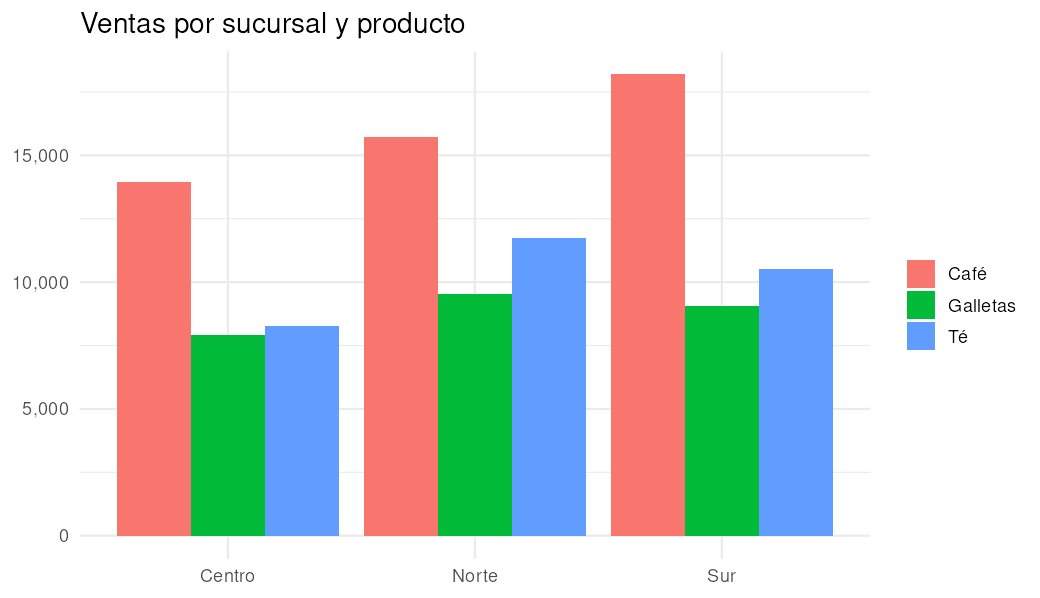
Preguntas frecuentes
¿geom_col o geom_bar?
geom_col usa el valor que le das. geom_bar cuenta filas por su cuenta.
¿Mi eje debe empezar en cero?
En barras, sí: la longitud representa el valor. ggplot2 lo hace por omisión con geom_col.